Setting up monitoring with NestJS, Prometheus and Grafana
A production application went down and was recovered six hours later after users started reaching support and developers rebooted the app. This happened on a real production system at my friend’s company. Money was lost, the customers were angry, and the developers scratched their heads about how it could happen. This is an excellent example of how monitoring and alerting could have solved the problem or reduced the downtime to the minimum. Sometimes developers neglect these tools to move faster, but having them for any production system is essential. In this article, I will follow you through setting up metrics and monitoring using a NestJS web application. No sophisticated setup is needed; everything is done on a local machine with the help of Docker.

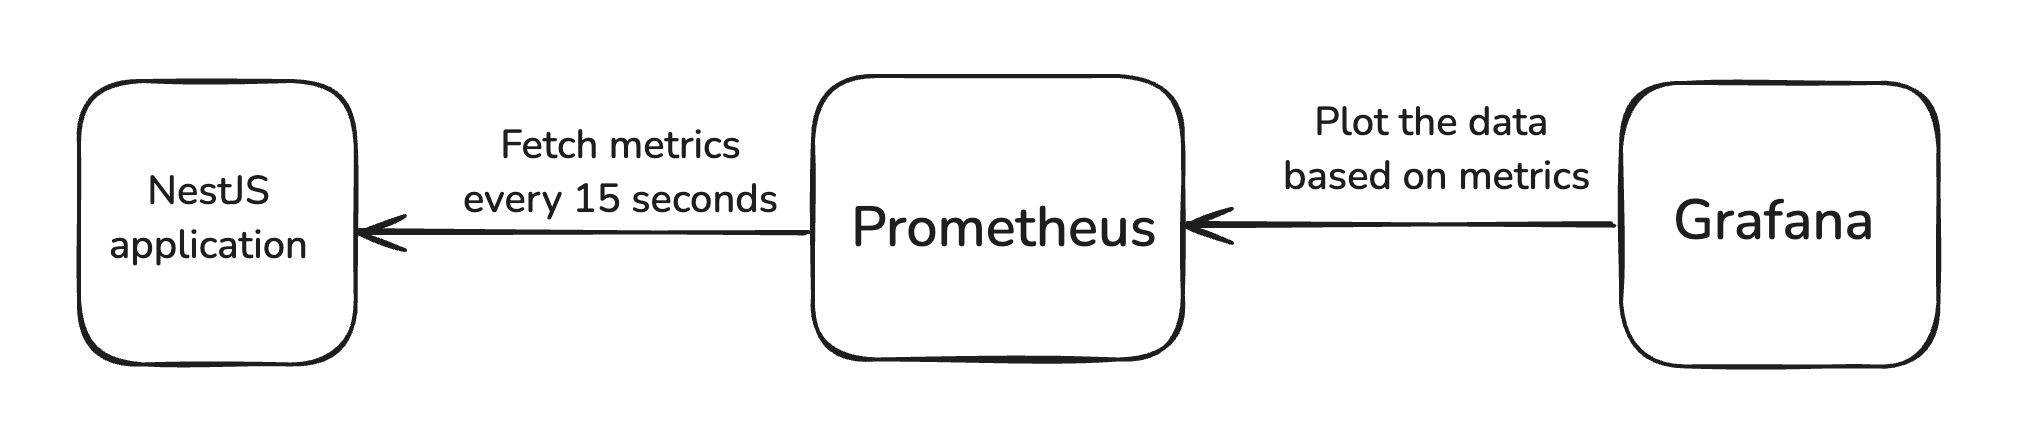
I am going to have three actors in this setup:
- A NestJS web application that I will build.
- Prometheus - a metrics collection system.
- Grafana - a data visualisation tool.
To follow up with me, you need to have Node.js and Docker on your machine.
Let’s start with setting up a Node.js/NestJS application that will expose a REST API.
I will name the app metr101. Execute the following command and select npm when
prompted to choose a package manager:
npx @nestjs/cli new metr101
Navigate to the metr101 folder and start the app:
npm i
npm star
You should now see “Hello World!” once you open http://localhost:3000/.
The next step is to expose metrics data so that they can be consumed by Prometheus. Go on and install Prometheus dependencies that will help expose this data:
npm install @willsoto/nestjs-prometheus prom-client
Let’s say I want to monitor how often the hello world endpoint was called.
Open src/app.module.ts and adjust it to look like this:
import { Module } from '@nestjs/common';
import { AppController } from './app.controller';
import { AppService } from './app.service';
import {
  PrometheusModule,
  makeCounterProvider,
} from "@willsoto/nestjs-prometheus";

@Module({
  imports: [PrometheusModule.register({ path: "/metrics" })],
  controllers: [AppController],
  providers: [
    AppService,
    makeCounterProvider({
      name: "get_hello_calls",
      help: "Total number of getHello calls",
    }),
  ],
})
export class AppModule { }
There are two parts here:
- Registering the Prometheus module with
PrometheusModule.register({ path: "/metrics" }). This will expose metrics information on the/metrics. - Registering a counter with
makeCounterProvider(). This will allow data to be written to aget_hello_callscounter that can be accessed from the service code.
Open src/app.service.ts and adjust the code to increment the counter every time
getHello() is called. The service code will look like this:
import { Injectable } from '@nestjs/common';
import { InjectMetric } from "@willsoto/nestjs-prometheus";
import { Counter } from "prom-client";

@Injectable()
export class AppService {
  constructor(@InjectMetric("get_hello_calls") public counter: Counter<string>) {}

  getHello(): string {
    this.counter.inc();
    return 'Hello World!';
  }
}
Once you restart the app and navigate to http://localhost:3000/metrics, you should see
a lot of different default metrics as well as get_hello_calls. It will look like this:
# HELP get_hello_calls Total number of getHello calls
# TYPE get_hello_calls counter
get_hello_calls 0
If you hit http://localhost:3000 a couple of times and refresh http://localhost:3000/metrics,
the value of get_hello_calls will increase.
That’s the simplest custom metric we can add. The next step is to expose it to Prometheus.
Dockerizing the infrastructure
Starting Prometheus and Grafana locally requires a good amount of effort. Luckily, it can be simplified with Docker. However, we also need to dockerize the Node.js application so that it can be reached from the Prometheus container via the Docker network.
Add Dockerfile in the root of the project with the following content:
FROM node:22-alpine AS builder
WORKDIR /app
COPY package*.json ./
COPY nest-cli.json ./
COPY tsconfig*.json ./
COPY src/ ./src
RUN npm ci && npm run build

FROM node:22-alpine
WORKDIR /app
COPY --from=builder /app/node_modules ./node_modules
COPY --from=builder /app/dist ./dist
CMD [ "node", "dist/main.js" ]
This will allow us to build a Docker image with the app inside.
Now, let’s combine all the components in a Docker Compose definition.
Create docker-compose.yml with the following content:
services:
  metr101-app:
    build: .
    container_name: metr101-app
    ports:
      - "3000:3000"
    depends_on:
      - metr101-prometheus

  metr101-prometheus:
    image: prom/prometheus:v2.54.1
    container_name: metr101-prometheus
    ports:
      - "9090:9090"
    volumes:
      - ./prometheus.yml:/etc/prometheus/prometheus.yml

  metr101-grafana:
    image: grafana/grafana:11.2.2
    container_name: metr101-grafana
    ports:
      - "3030:3000"
This configuration will start three services:
- metr101-app - the Node.js application built from the
Dockerfile. Accessible on the port 3000. - metr101-prometheus - a Prometheus instance accessible on 9090.
- metr101-grafana a Grafana instance accessible on 3030.
Before we start all together, one more detail needs to be added. We need to add a Prometheus
configuration so that it will be picked by Docker Compose. Create prometheus.yml in the root
of the project with the following content:
scrape_configs:
  - job_name: metr101-service
    scrape_interval: 15s
    scrape_timeout: 10s
    metrics_path: /metrics
    static_configs:
      - targets: ["metr101-app:3000"]
The configuration is self-explaining. It will pull /metrics every 15 seconds
with a timeout of 10 seconds. Note that the targets property specifies the name
of the app Docker container instead of localhost.
Everything is ready. No code changes are needed from this point onwards. Let’s start the infrastructure altogether. Execute:
docker compose up
Wait until all three containers are ready, and let’s test.
Ensure the app works by checking http://localhost:3000/metrics and navigating to the Prometheus UI http://localhost:9090/.
Start typing get_hello_calls in the search bar, select the value, and then press “Execute”.
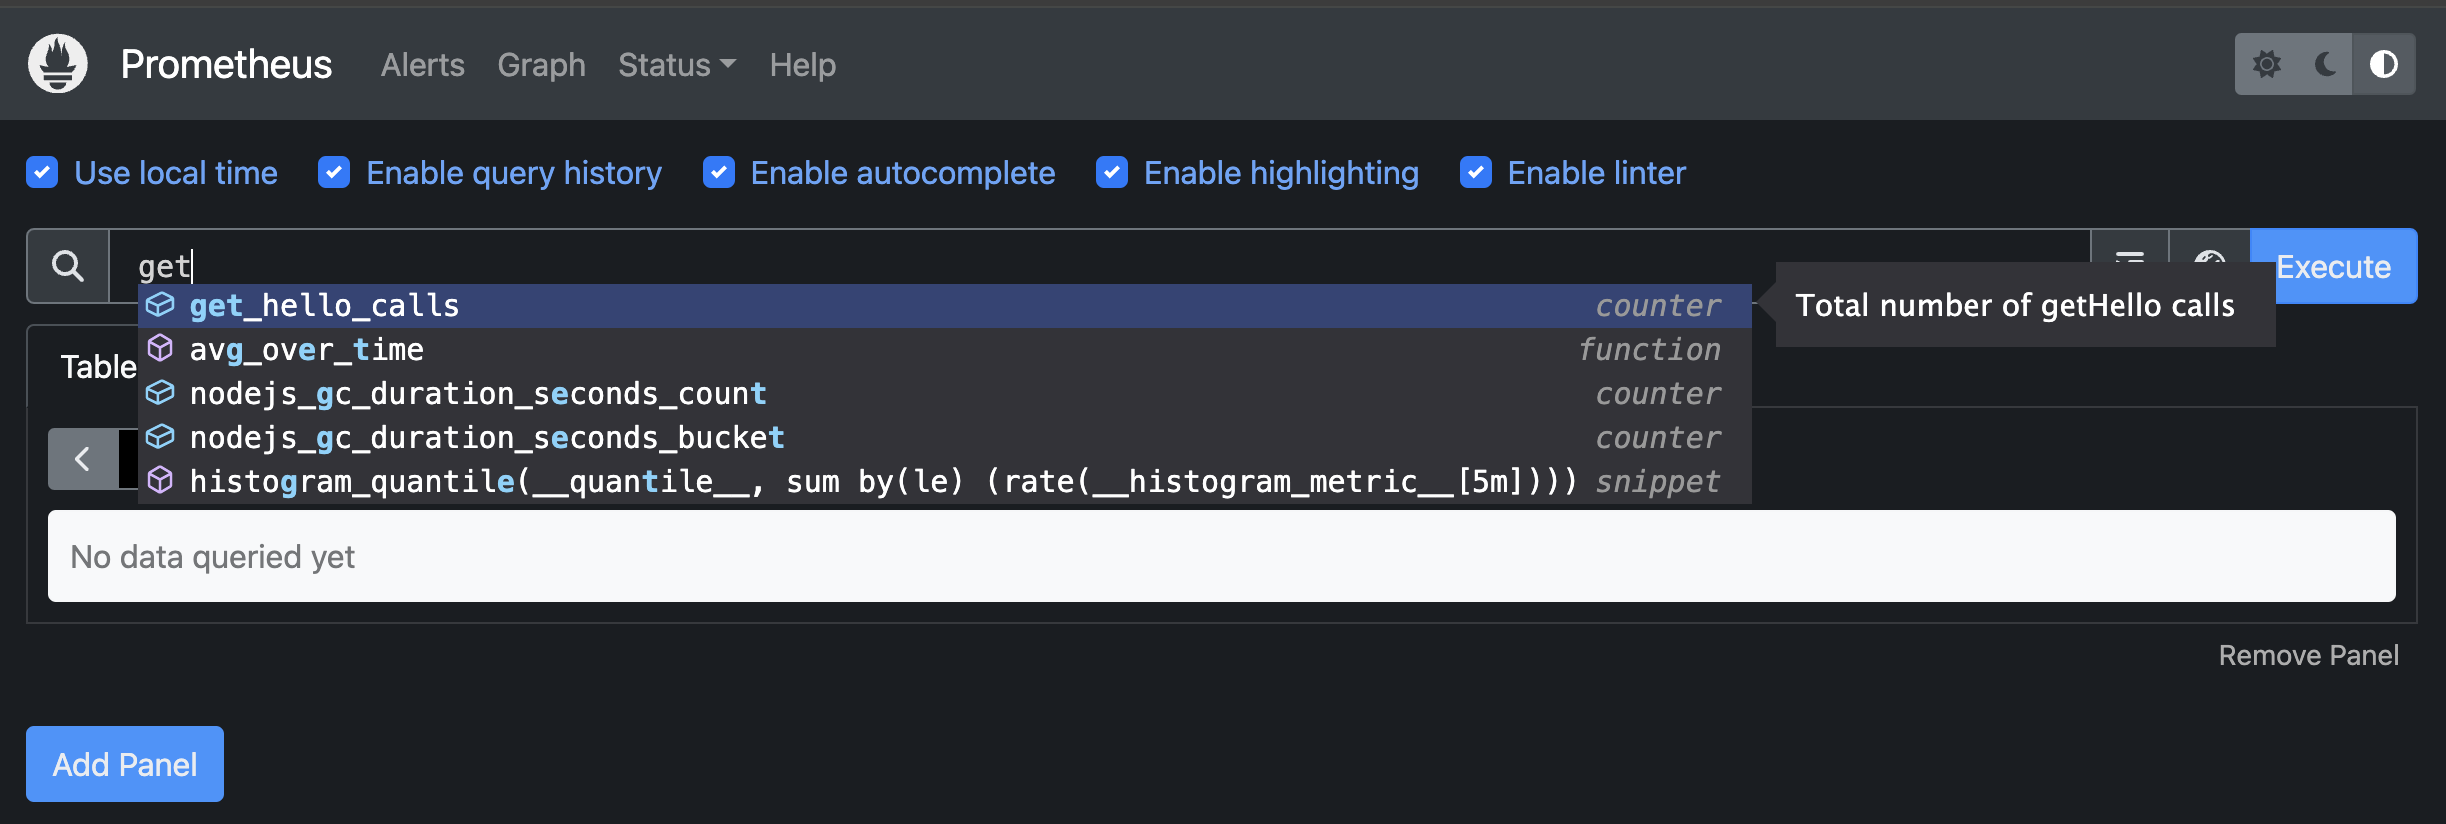
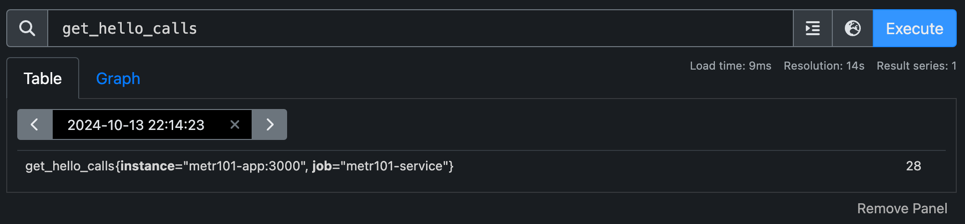
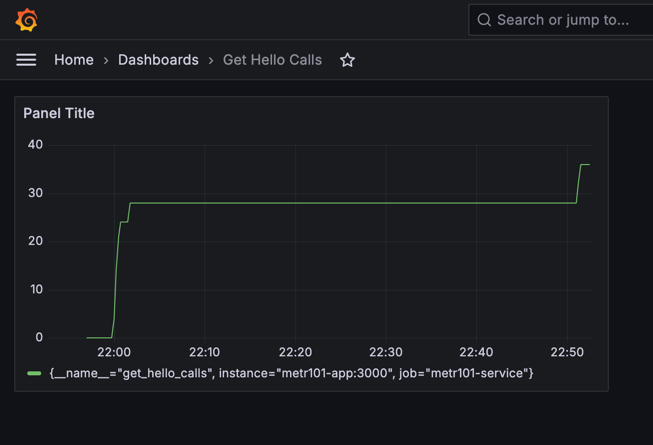
You will see the current value of the get_hello_calls metric.
If you hit http://localhost:3000 a couple of times and repeat
the search, the value will be adjusted.
There is also a Graph tab that lets you explore how the value changes over time,
but that’s not the primary purpose of Prometheus. Grafana has a comprehensive set
of data visualization features. Let’s jump to Grafana and add a diagram there.
Navigate to http://localhost:3030/ and use admin/admin to log in (it will offer
to change the password at the first login).
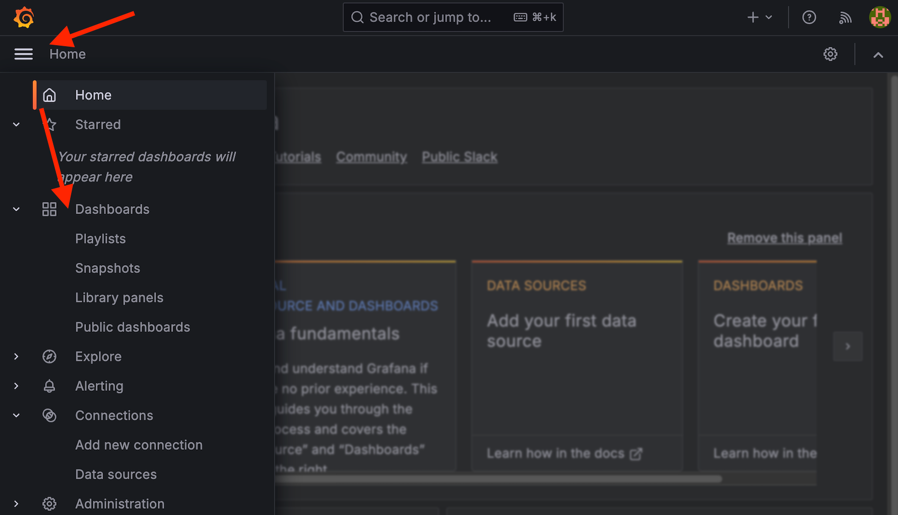
After logging in, open the side panel and press “Dashboards”.
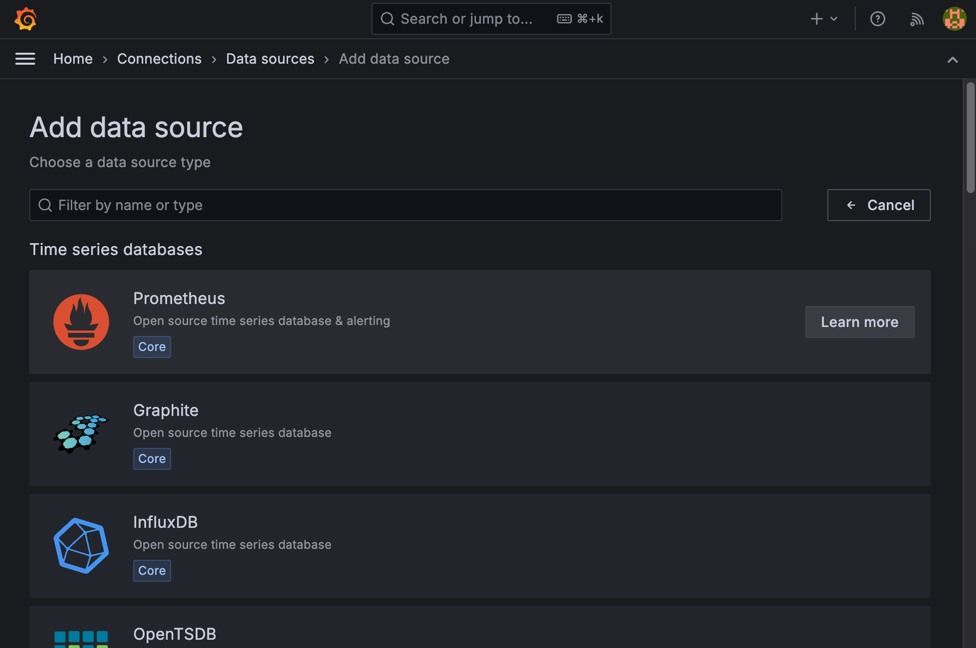
Press “Create Dashboard”, then “Add visualization” and then “Configure a new datasource”. Select “Prometheus” from the list of available datasources.
Enter http://metr101-prometheus:9090/ in the Connection section and press “Save & test”.
It should be able to connect successfully.
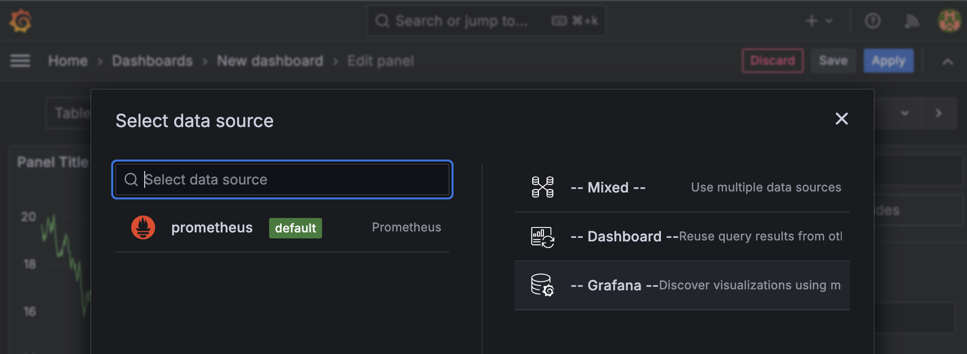
Now, once again open “Dashboards” in the side panel -> “Create Dashboard” -> “Add visualization”. This time, the Prometheus datasource is there, select it.
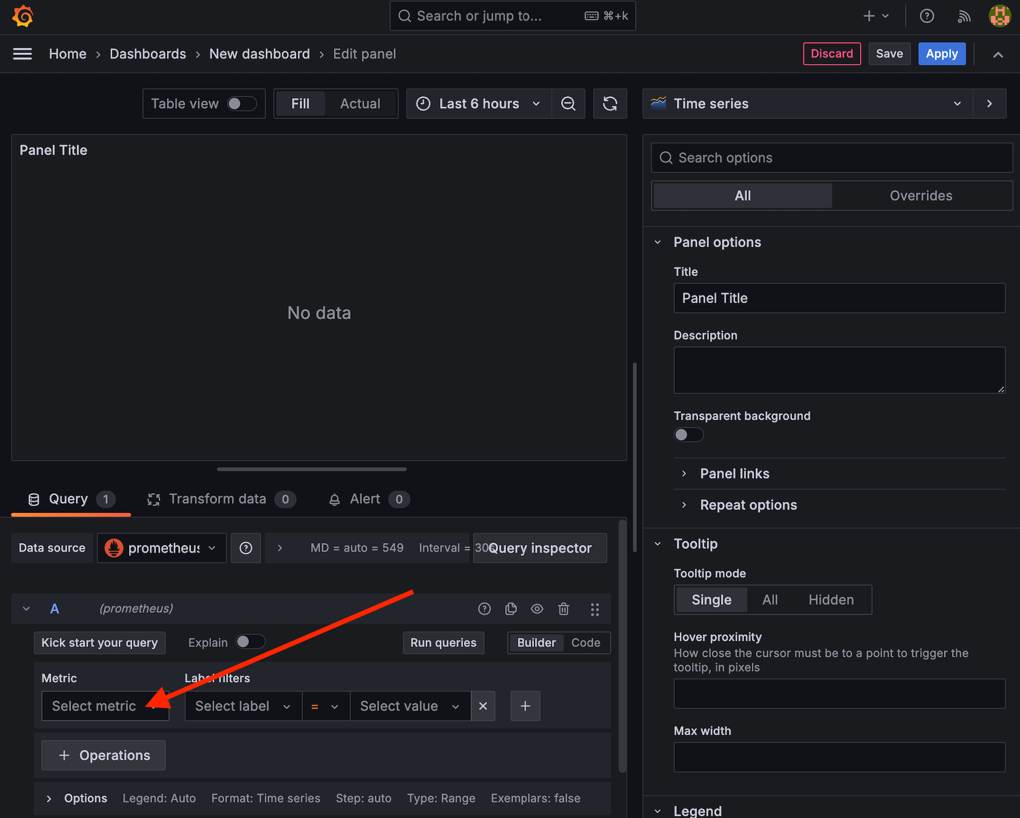
In the setup window, press “Select metric”, choose get_hello_calls, and press “Save”.
Now you’ve completed the setup, you can monitor your app and visualize the data in a Grafana diagram.
Congratulations, you’ve done it. That’s all that we needed to set up simple monitoring. Here, we operate with a counter, but there are more sophisticated metrics that can help control the app more granularly. After configuring monitoring, you might also want to set up alerts so that you can be actively notified when something goes wrong. That’s a good subject for the next article.
You can find the project source code on GitHub.